
We're in the process of moving to www.SE1.news - find the latest news there.
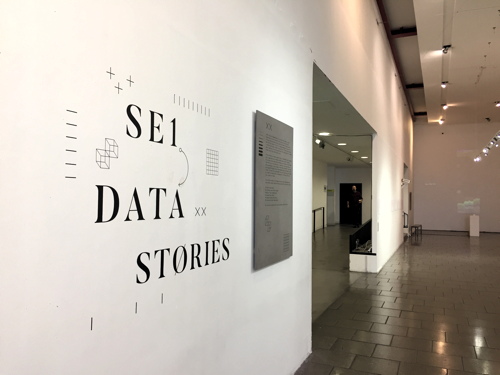
SE1 Data Stories
This event is in the past. This is an archive page for reference.
How many people live in SE1?
How many dogs and cats are there?
How have local bus routes changed over time?
What's the average property value?
From digital visualisations based on live transport data, to work that explores the food culture of the area, SE1 Data Stories offers insight into the design-led approach to data visualisation by LCC's design students, staff, practitioners, researchers and the University's data visualisation research hub.
The exhibition features the collaborative work of both undergraduate and postgraduate students in the LCC's School of Design.
Where
This belongs to
Tools
- Discuss this event in the forum
- Get event in iCalendar format
(for mobile phones, Apple Calendar etc) - Remind me (Google Calendar)
Updated: 8 October 2016
Additions/corrections welcome.
Additions/corrections welcome.
This event is in the past. This is an archive page for reference.

Follow us
Email newsletter
For the latest local news and events direct to your inbox every Monday, you need our weekly email newsletter SE1 Direct.